因为"某某氏"那边需要看h5领券活动的后台数据,而且发布在两个渠道(ofo客户端、微信)。
需要展示活动券的领取数(能分别模糊查询openID、券码、渠道、时间)以及访问量趋势(各渠道数据、日期)。
所以就打算一个弄表格,一个弄折线图。
表格选来选去还是用BootstrapTable,因为功能挺强大的,但有点复杂。
Github:<gb user="wenzhixin" type="star" count="1" size="1" width="200">bootstrap-table</gb>
文档:http://bootstrap-table.wenzhixin.net.cn/zh-cn/documentation/
各种折腾之后
效果如下:http://demo.laji.blog/data_backend/data_get.html
每一列都可以进行模糊搜索,可以导出各种格式的数据,因为设置的是服务端进行分页,所以每次都是通过url加上各个参数去后台获取json数据。
数据格式如下:
http://demo.laji.blog/data_backend/data.php?search=&sort=id&order=asc&offset=0&limit=10&_=1490695578970
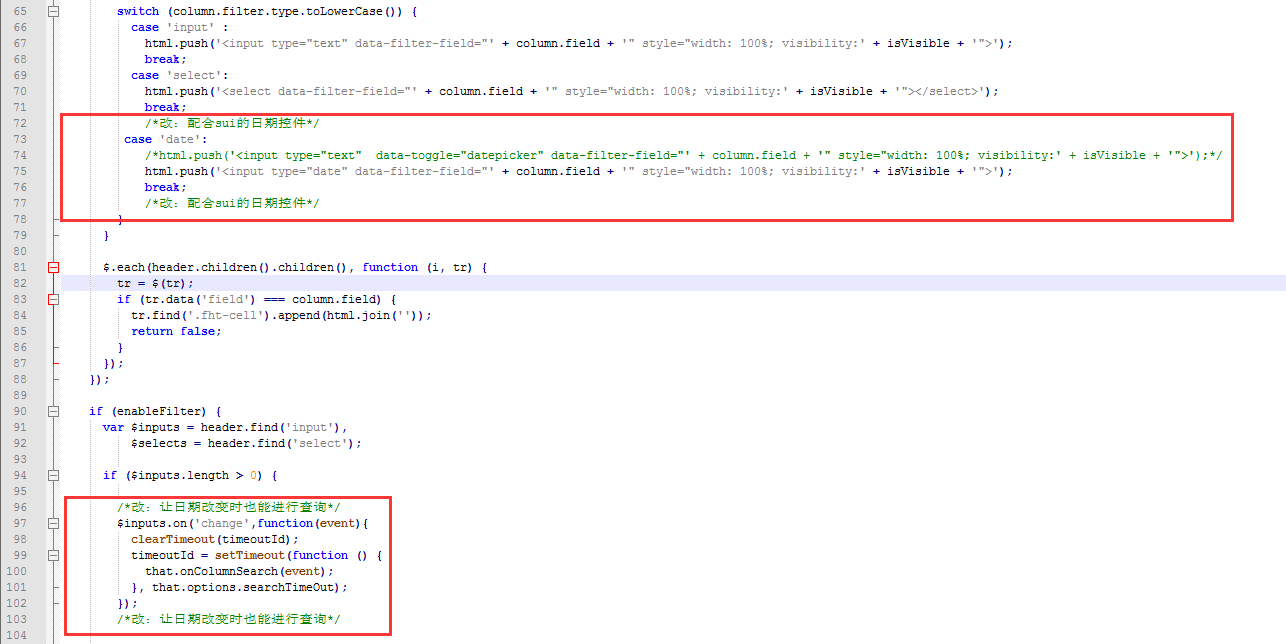
插一句,我改了extensions/select2-filter/下的bootstrap-table-select2-filter.js文件,因为发现过滤器扩展只有输入框和下拉框,于是加上了个日历控件,但又发现日期控件的值改变时,没有去后台获取数据,就加了个change事件。
代码
<!doctype html>
<html lang="en">
<head>
    <meta charset="UTF-8">
    <meta name="viewport" content="width=device-width, user-scalable=no, initial-scale=1.0, maximum-scale=1.0, minimum-scale=1.0">
    <meta http-equiv="X-UA-Compatible" content="ie=edge">
    <title>数据查询</title>
    <link rel="stylesheet" href="css/bootstrap.min.css">
    <link rel="stylesheet" href="css/bootstrap-table.min.css">
    <!--<link rel="stylesheet" href="css/bootstrap-editable.css">-->
    <link rel="stylesheet" href="css/jquery-ui-1.10.3.custom.css">
    <link rel="stylesheet" href="css/sui.min.css">
    <link rel="stylesheet" href="css/sui-append.min.css">
    <script src="js/jquery.min.js"></script>
    <script src="js/bootstrap.min.js"></script>
    <script src="js/bootstrap-table.min.js"></script>
    <script src="js/locale/bootstrap-table-zh-CN.min.js"></script>
    <script src="js/extensions/export/bootstrap-table-export.min.js"></script>
    <script src="js/tableExport.js"></script>
    <link rel="stylesheet" href="css/select2.min.css">
    <script src="js/extensions/select2-filter/bootstrap-table-select2-filter_gai.js"></script>
    <script src="js/select2.min.js"></script>
    <script src="js/holder.js"></script>
    <!--[if lt IE 9]>
    <script src="js/html5shiv.min.js"></script>
    <script src="js/respond.min.js"></script>
    <script src="js/json2.min.js"></script>
    <![endif]-->
</head>
<body>
<div id="toolbar">
    <select class="form-control">
        <option value="10">导出前10条</option>
        <option value="100">导出前100条</option>
        <option value="500">导出前500条</option>
        <option value="1000">导出前1000条</option>
        <option value="5000">导出前5000条</option>
        <option value="10000">导出前1w条</option>
        <option value="20000">导出前2w条</option>
        <option value="50000">导出前5w条</option>
        <option value="100000">导出前10w条</option>
        <option value="1000000">导出前100w条</option>
    </select>
    <span>*点击最右侧按钮选择格式并导出数据</span>
</div>
<table id="table_get"></table>
    <script>
        $(function () {
            //1.初始化Table
            var oTable = new TableInit();
            oTable.Init();
            //2.初始化Button的点击事件
            var oButtonInit = new ButtonInit();
            oButtonInit.Init();
        });
        var config = {
            url: 'data.php',         //请求后台的URL(*)
            dataType: 'json',           //服务器返回的数据类型
            method: 'get',                      //请求方式(*)
            toolbar: '#toolbar',                //工具按钮用哪个容器
            striped: true,                      //是否显示行间隔色
            cache: false,                       //是否使用缓存,默认为true,所以一般情况下需要设置一下这个属性(*)
            pagination: true,                   //是否显示分页(*)
            sortable: true,                     //是否启用排序
//                    queryParams: oTableInit.queryParams(
//                        {
//                            'sort':0,
//                            'limit':10
//                        }),//重写传递查询参数(*) url + '?sort=XXXX&order=asc&offset=0&limit=10'
            /*
             请求服务器数据时,你可以通过重写参数的方式添加一些额外的参数,
             例如 toolbar 中的参数 如果 queryParamsType = 'limit' ,返回参数必须包含
             limit, offset, search, sort, order 否则, 需要包含:
             pageSize, pageNumber, searchText, sortName, sortOrder.
             返回false将会终止请求
             */
            //===
            pageSize: 10,                       //每页的记录行数(*)
            pageNumber:1,                       //初始化加载第一页,默认第一页
            sortOrder: "asc",                   //排序方式
            sortName:"id",
//                    searchText:"",
            //===
            sidePagination: "server",           //分页方式:client客户端分页,server服务端分页(*)
            pageList: [10, 25, 50, 100, 500, 'All'],        //可供选择的每页的行数(*) 当返回的总条数大于'All'前面的500,才会显示All
//                    search: true,                       //是否显示表格搜索
            strictSearch: true,
            showColumns: true,                  //是否显示所有的列
            showRefresh: true,                  //是否显示刷新按钮
            minimumCountColumns: 2,             //最少允许的列数
            clickToSelect: false,                //是否启用点击选中行
            //height: 550,                        //行高,如果没有设置height属性,表格自动根据记录条数觉得表格高度
            uniqueId: "id",                     //每一行的唯一标识,一般为主键列
            showToggle:true,                    //是否显示详细视图和列表视图的切换按钮
            cardView: false,                    //是否显示详细视图
            detailView: false,                   //是否显示父子表
            sortStable: true,
            silentSort: false,
            showFooter: false,
            detailFormatter:'detailFormatter',
            showExport: true,
//                    resizable: true,
            showPaginationSwitch: true,
            togglePagination: false,
            striped: true,
            exportDataType: 'basic',              //'basic', 'all', 'selected'  //$('#toolbar .form-control').val()
            columns: [{
                field: 'id',
                title: 'ID',
                align: 'center',
                sortable: true,
                filter: {
                    type: "input"
                }
            },{
                field: 'openid',
                title: 'openID',
                align: 'center',
                sortable: true,
                filter: {
                    type: "input"
                }
            }, {
                field: 'code',
                title: '券码',
                align: 'center',
                sortable: true,
                filter: {
                    type: "input"
                }
            }, {
                field: 'source',
                title: '渠道',
                align: 'center',
                sortable: true,
                filter: {
                    type: "select",
                    data: ['wechat','ofo']
                }
            }, {
                field: 'time',
                title: '时间',
                align: 'center',
                sortable: true,
                filter: {
                    type: "date"
                }
            }, ],
            filter: true,
        };
        var TableInit = function () {
            var oTableInit = new Object();
            //初始化Table
            oTableInit.Init = function () {
                $('#table_get').bootstrapTable(config);
            };
            return oTableInit;
        };
        var ButtonInit = function () {
            var oInit = new Object();
//            var postdata = {};
            oInit.Init = function () {
                //初始化页面上面的按钮事件
            };
            return oInit;
        };
        $('#toolbar').find('select').change(function () {
            //config.exportDataType = $(this).val();
            //console.log(config.exportDataType);
            config.pageSize = $(this).val();
            $('#table_get').bootstrapTable('destroy').bootstrapTable(config);
        });
    </script>
</body>
</html>然后就是访问量了,直接用百度的Echarts即可,上面也有很多案例。
效果:http://demo.laji.blog/data_backend/data_view.html
数据格式
{
  "success":1,
  "data":{
    "wechat":[
        444,
        999,
        666,
        555,
        444
    ],
    "ofo":[
        333,
        111,
        555,
        222,
        1212
    ],
    "total":[
        777,
        1110,
        1221,
        777,
        1656
    ],
    "x_date":[
        "2017-3-11",
        "2017-3-12",
        "2017-3-13",
        "2017-3-14",
        "2017-3-15"
    ]
  }
}


Comments | NOTHING